Make every Finance team a hero in their organization.
One of the most important tasks within the finance teams is to monitor the performance of their company to ensure they are consistently growing and staying according to plan.
Problem
Create a montlhy performance report on the entire organization is a time-consuming task that involves a lot of manual work.
Goal
Allow customers to create a monthly performance reporst in a recurrent way and eliminating manual tasks.
Responsibilities
Collaborate with the research team, synthesise the evidence & findings, low-fi concepts, high-fidelity prototypes, conduct user interviews, iterating on designs and document UI components.
Solution
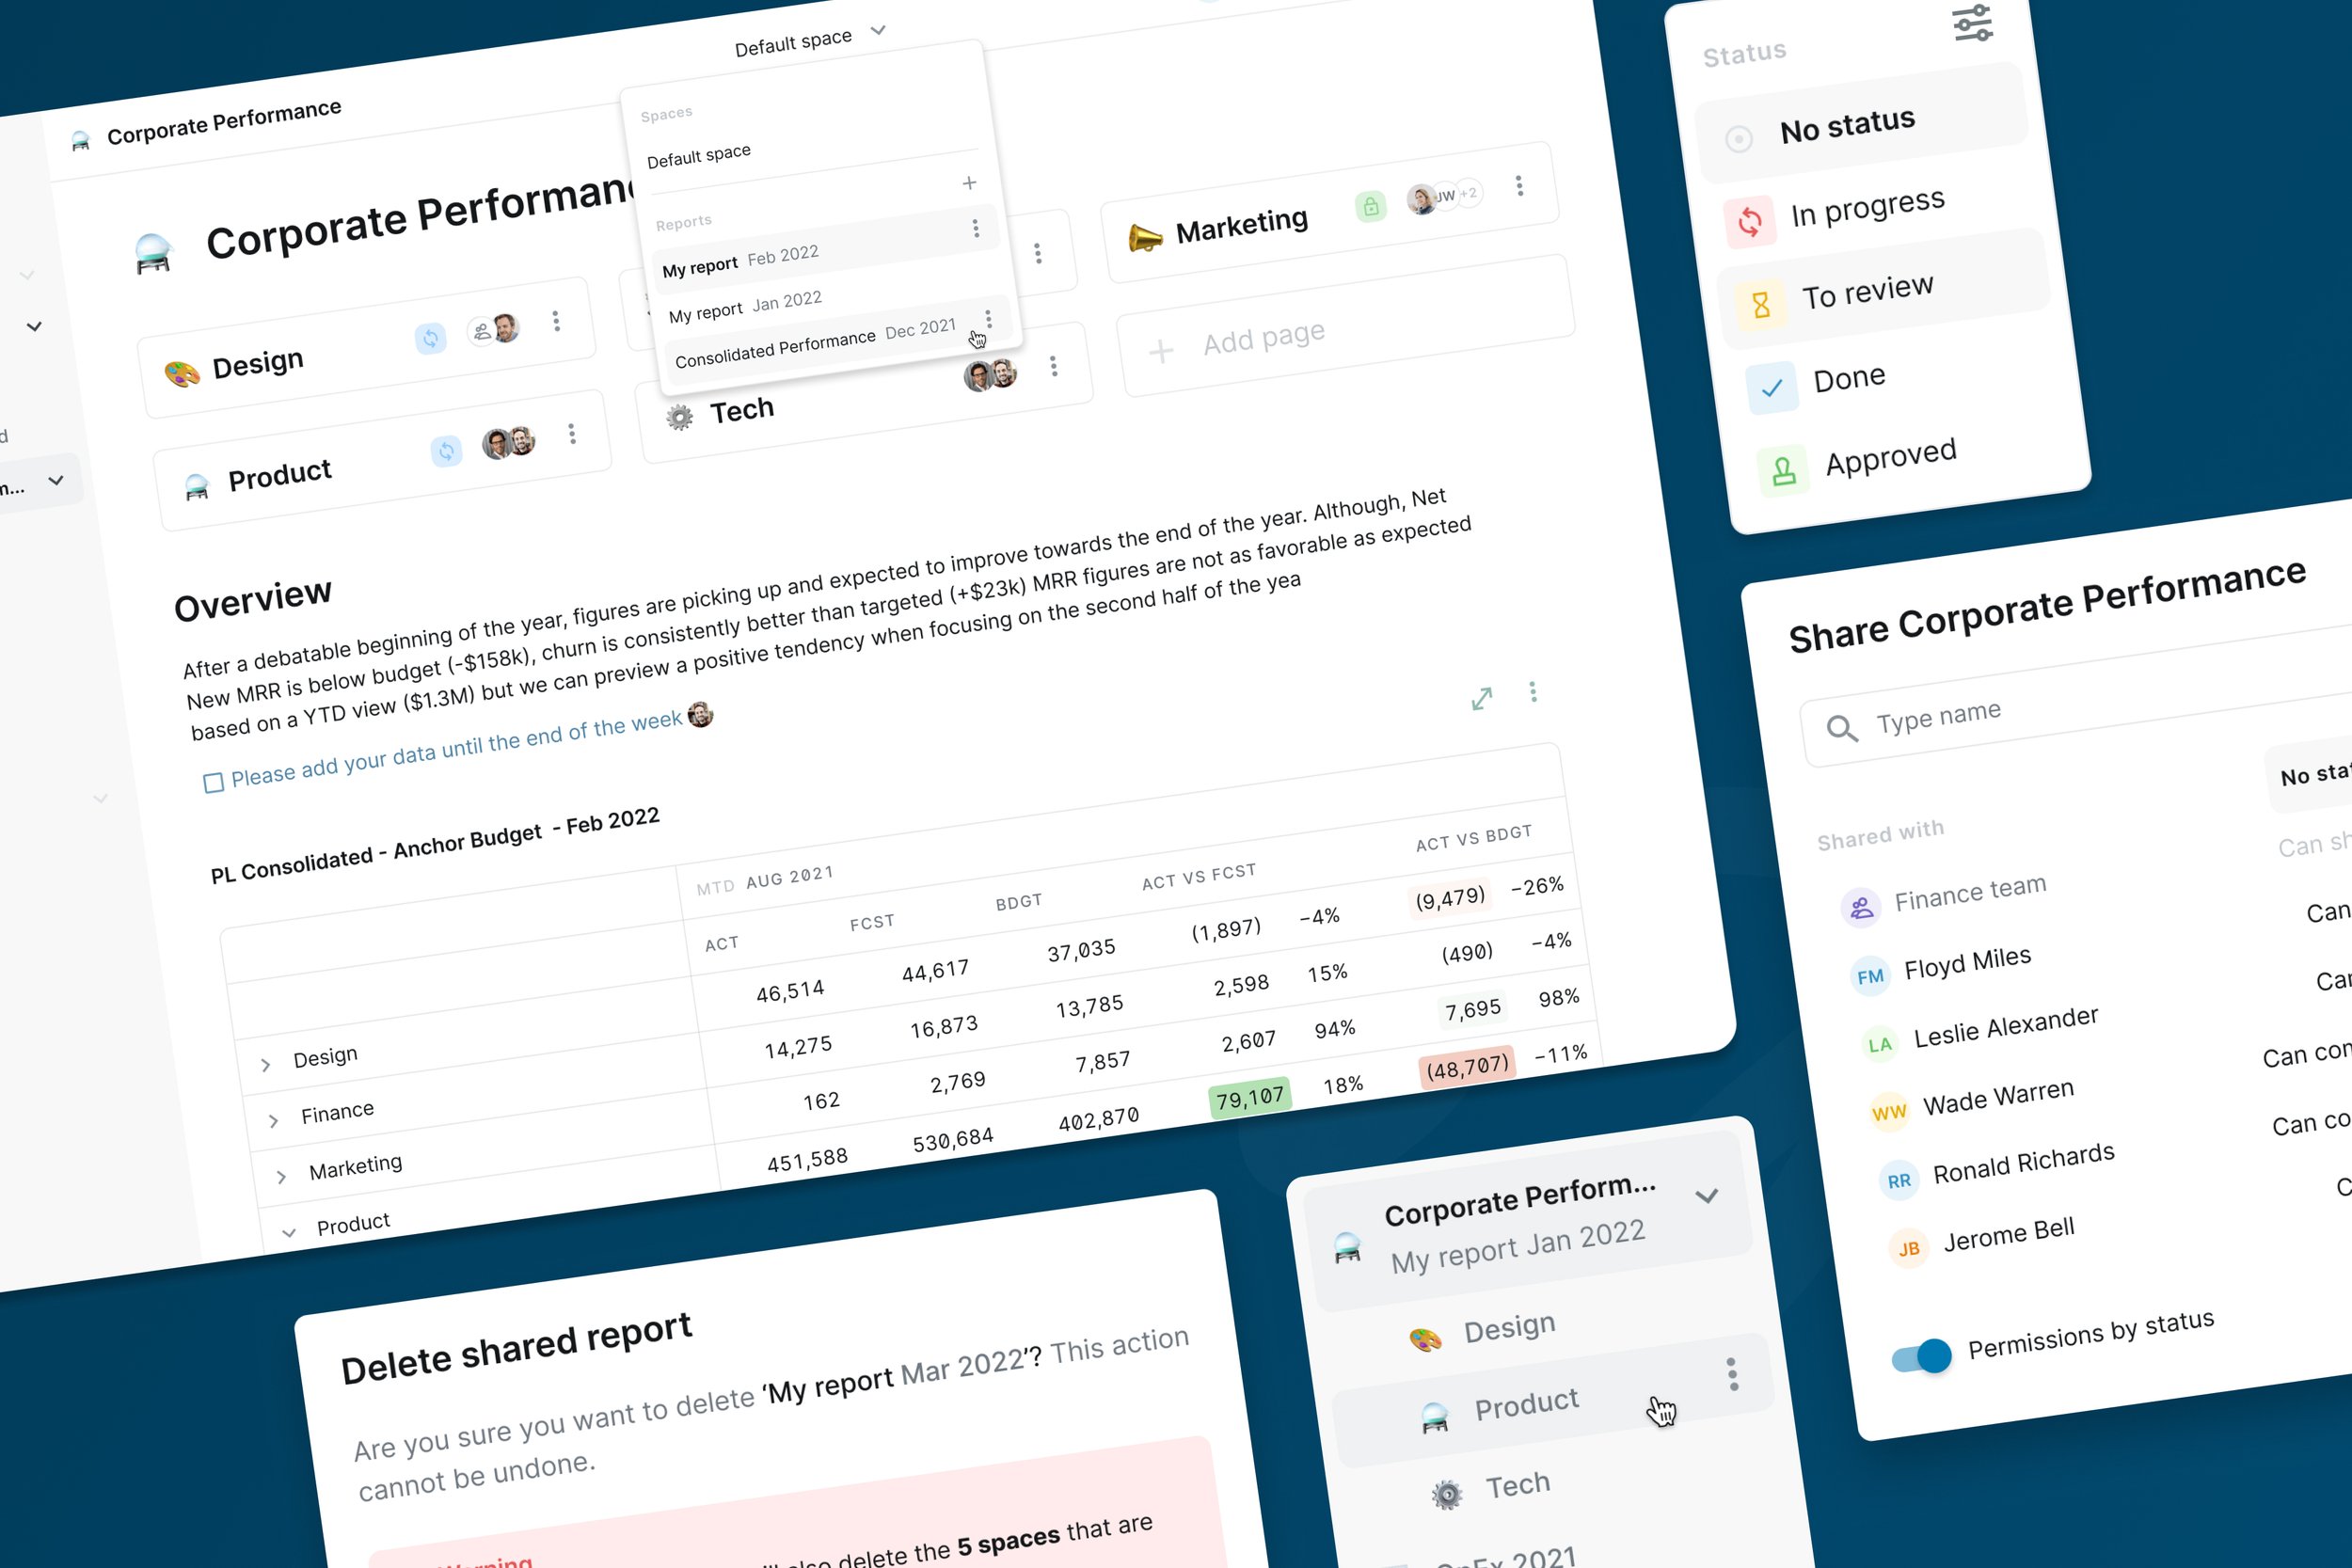
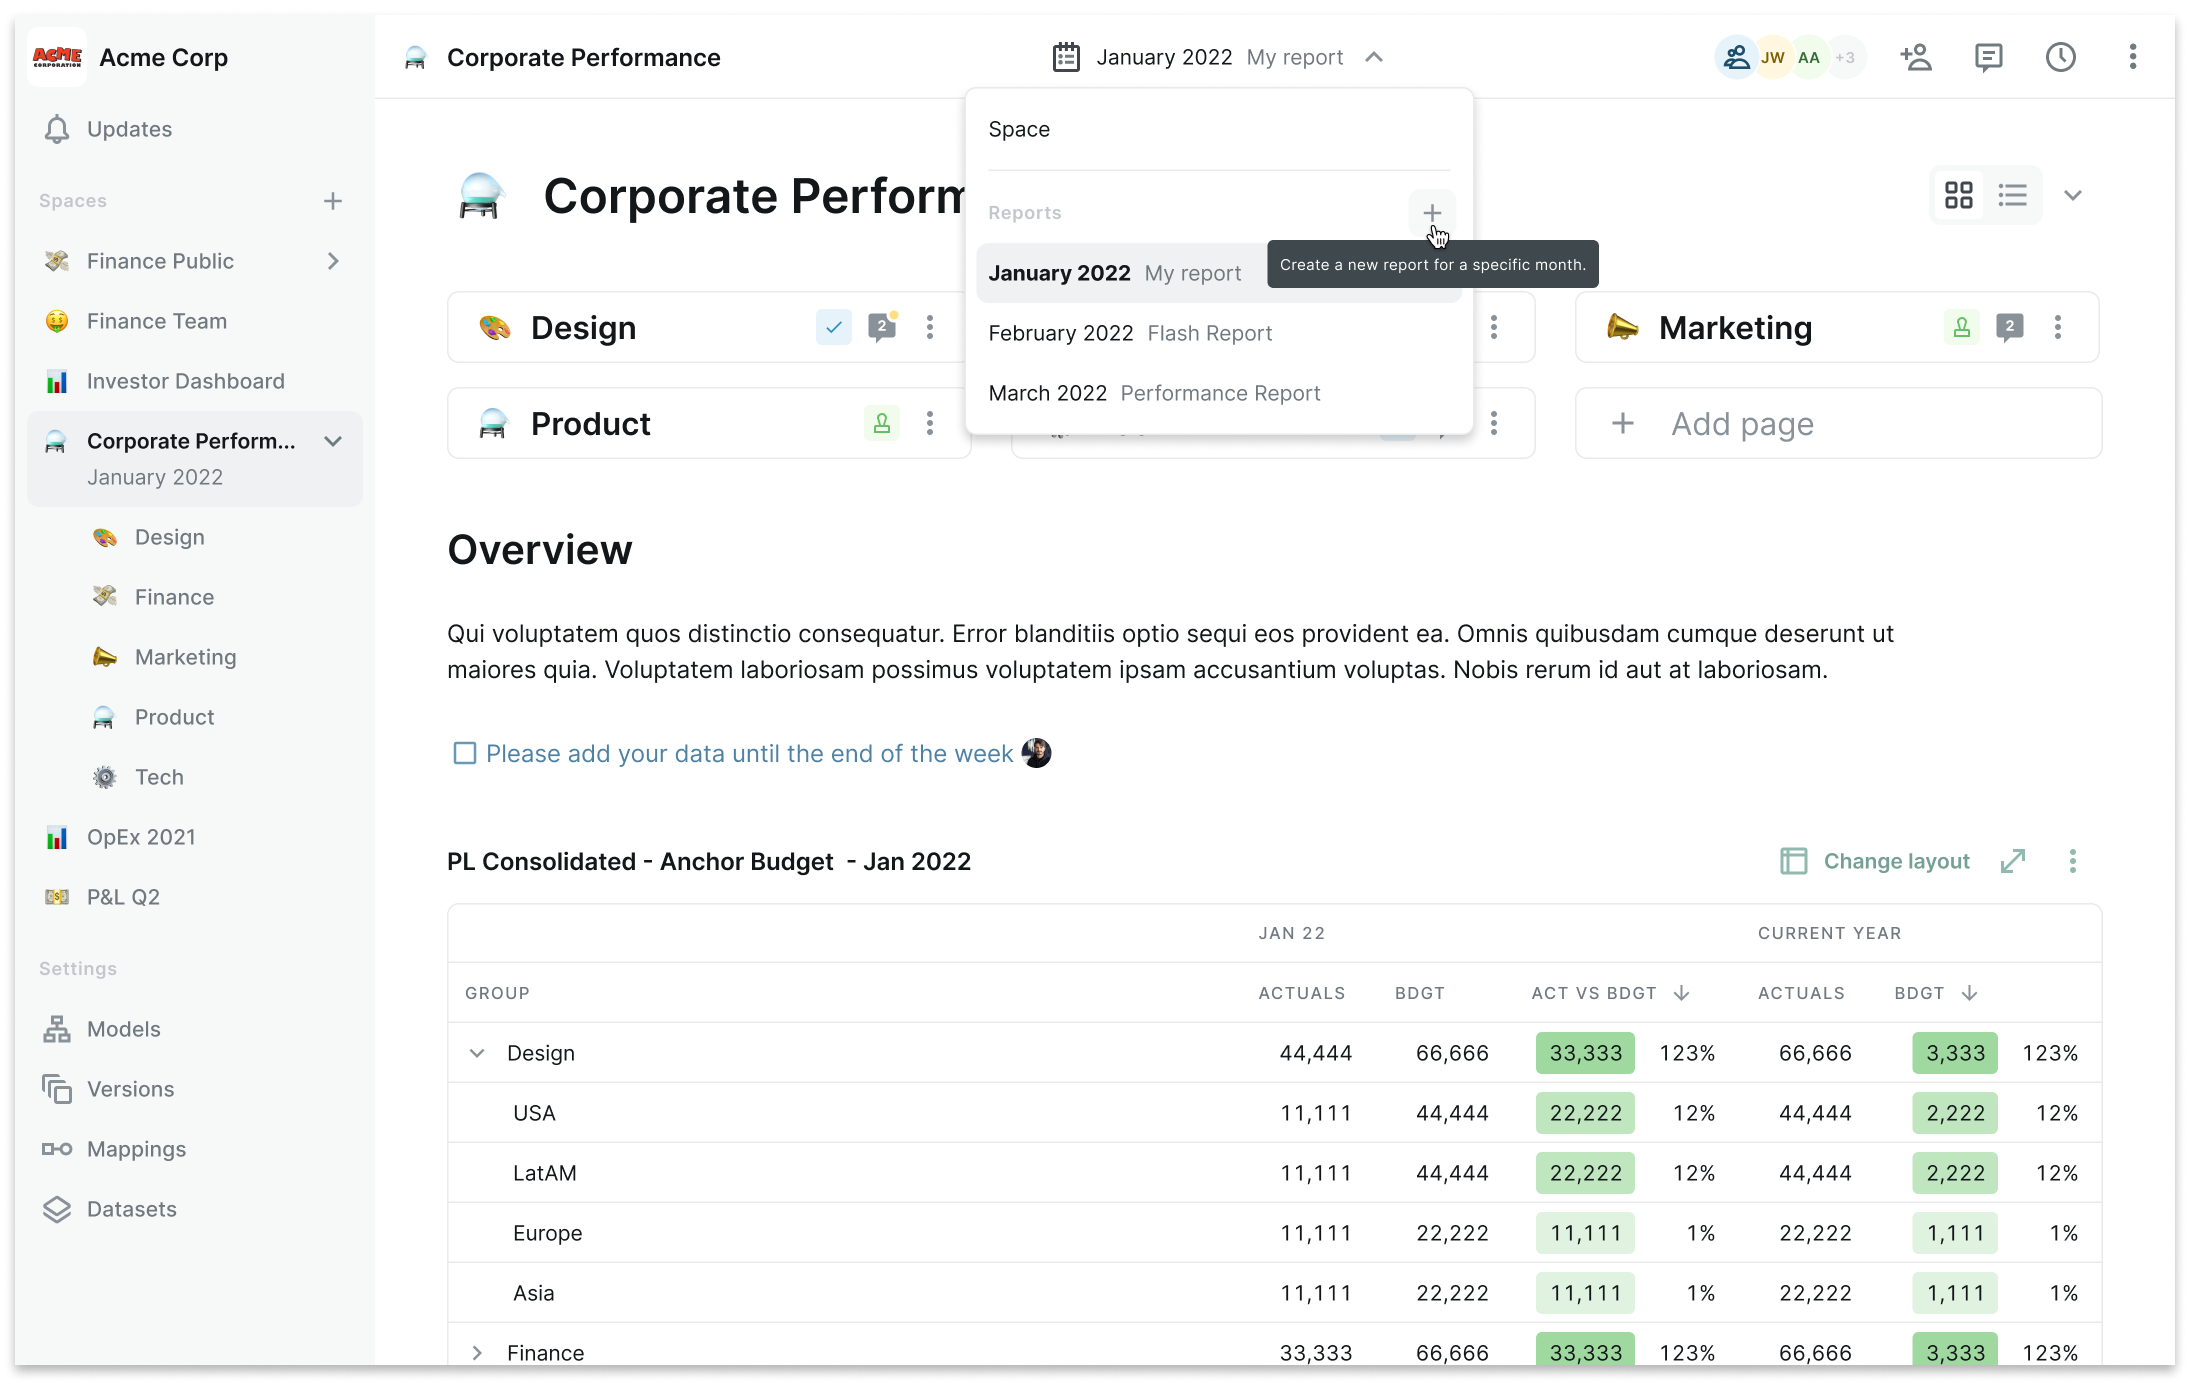
We’ve enabled our customers to create reports recurrently in a quick an easy way. Multiple key features were developed to support the entire use case.
Features:
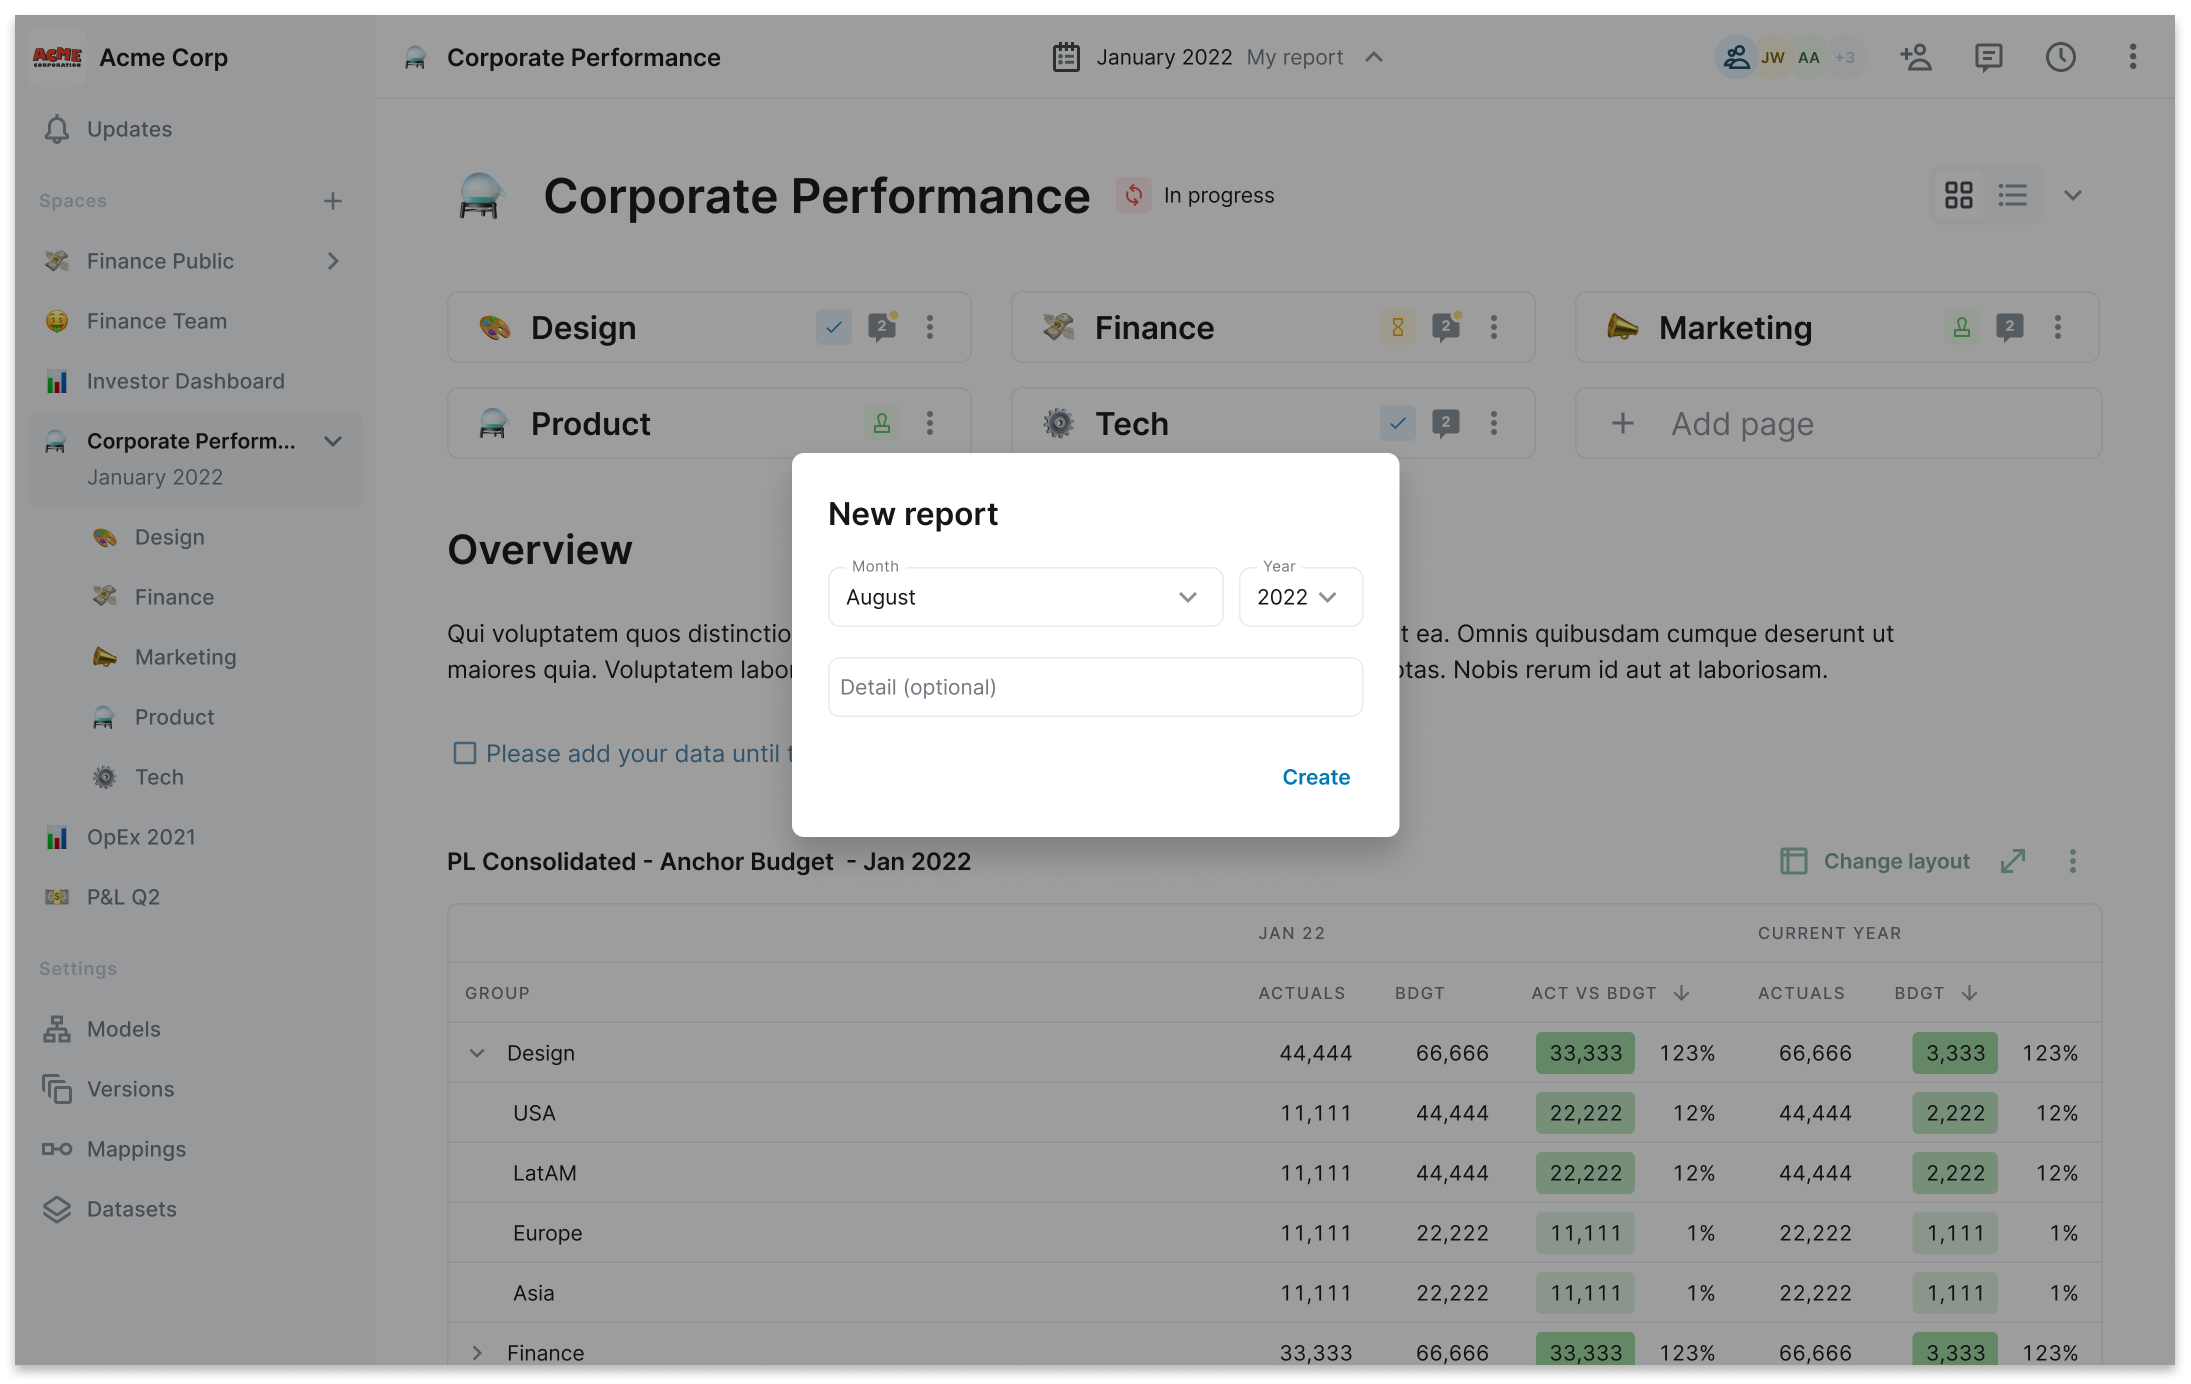
Report creation in a ¨one-single click¨;
Any data being used in tables or charts updates to the report specific time frame;
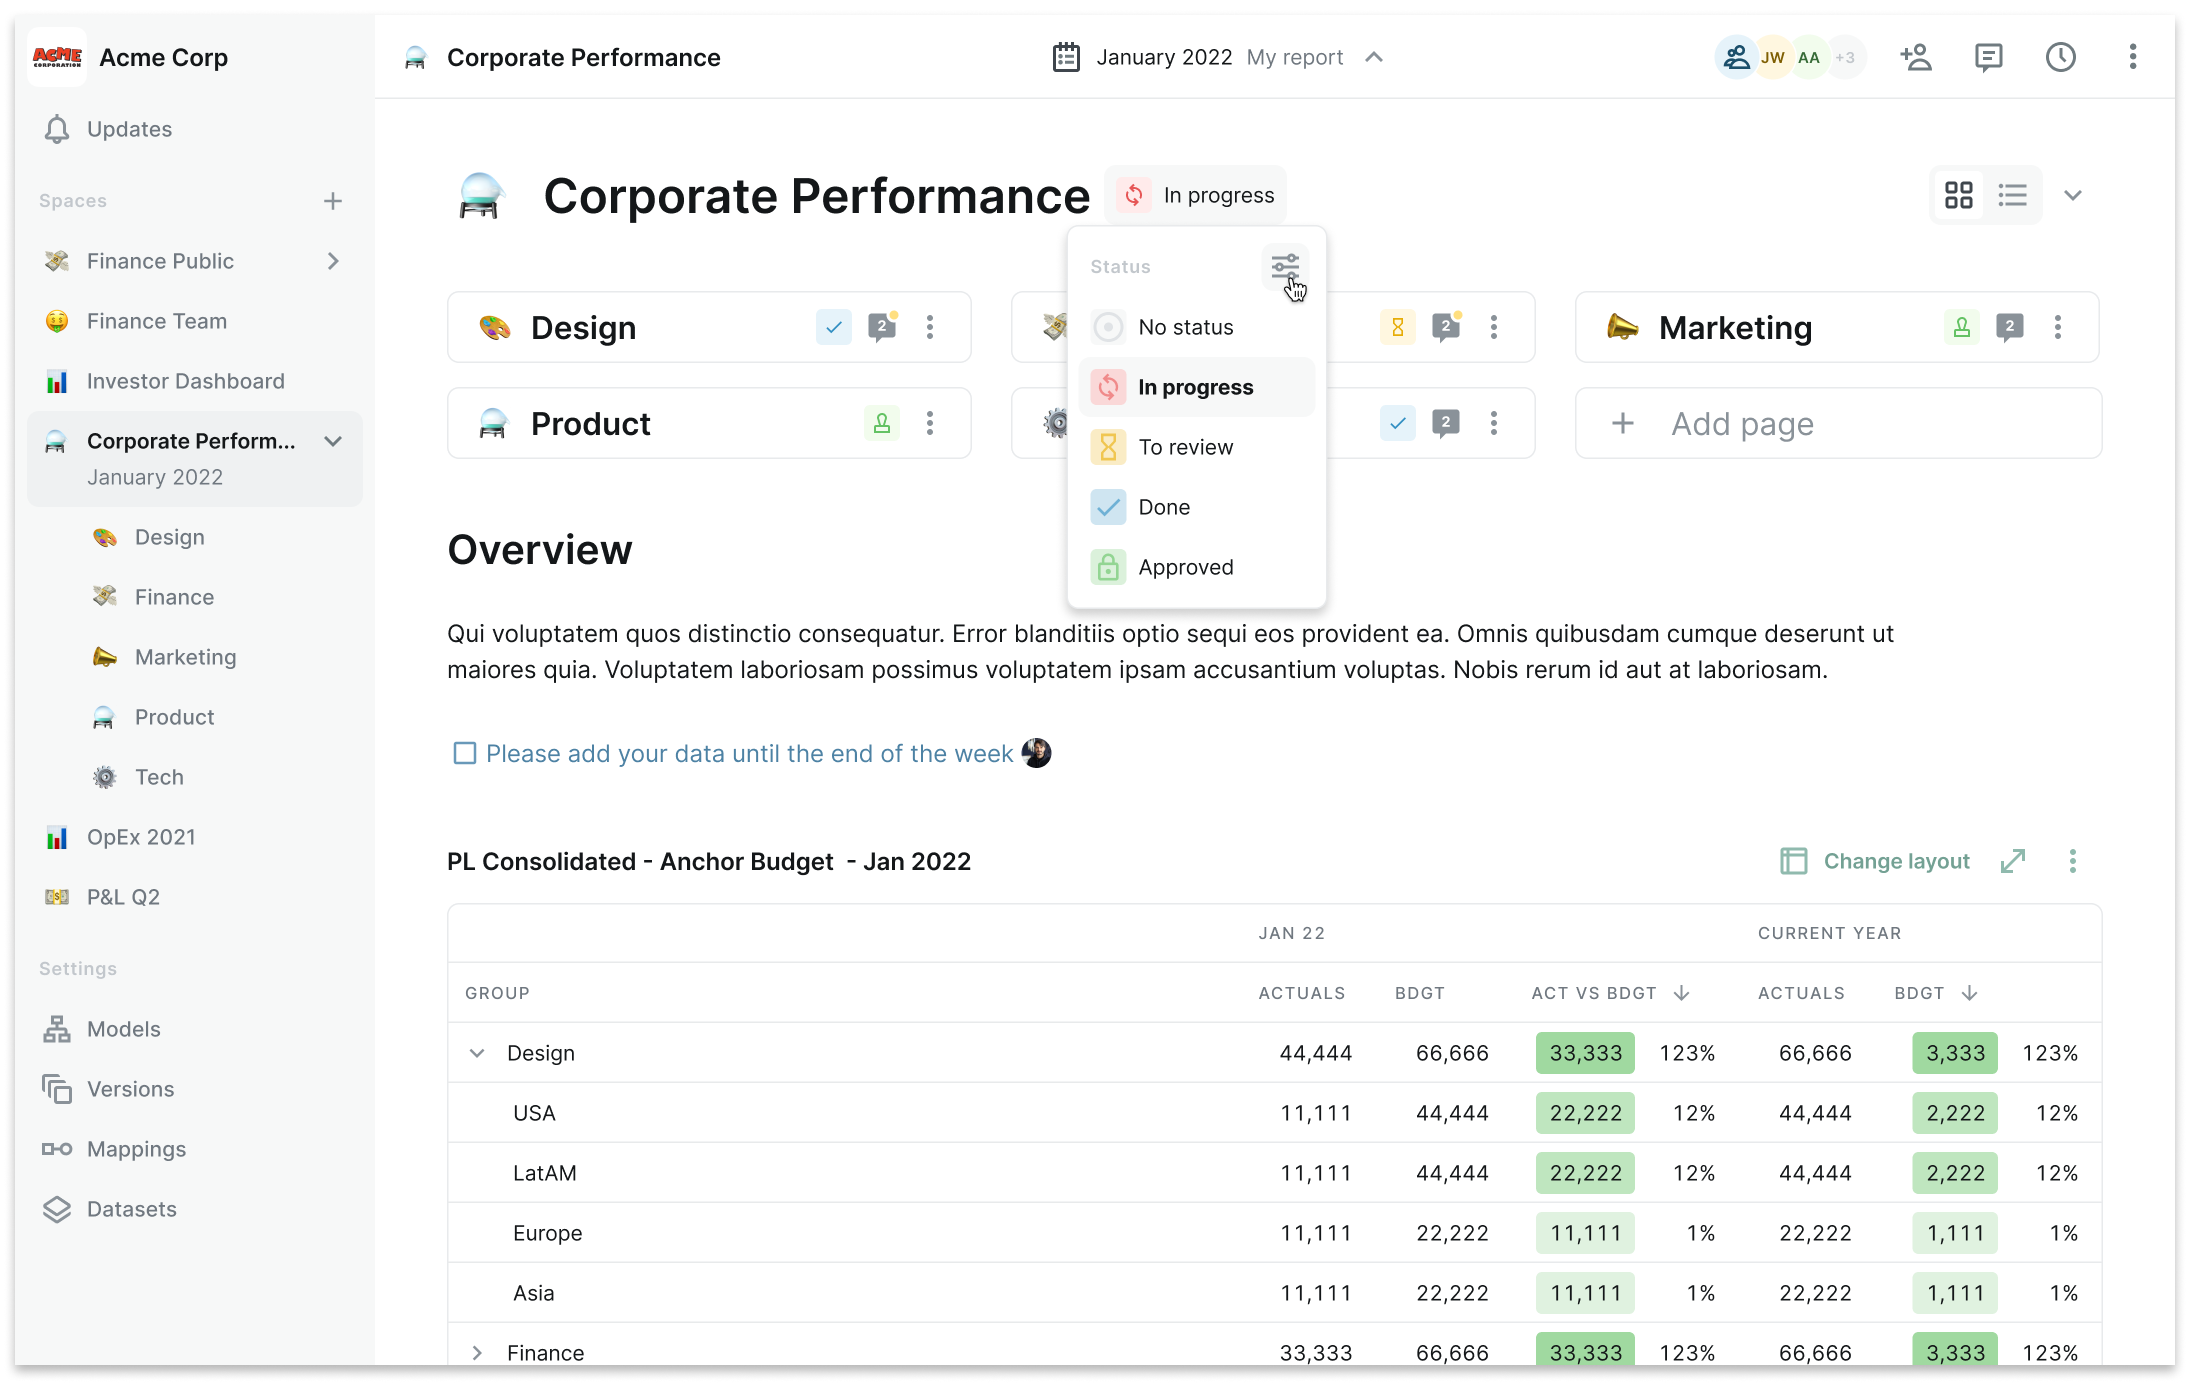
Reports can be associated with a specific status (more visibility over progress for the entire team);
Budget owners are notified based on the reports status (automation);
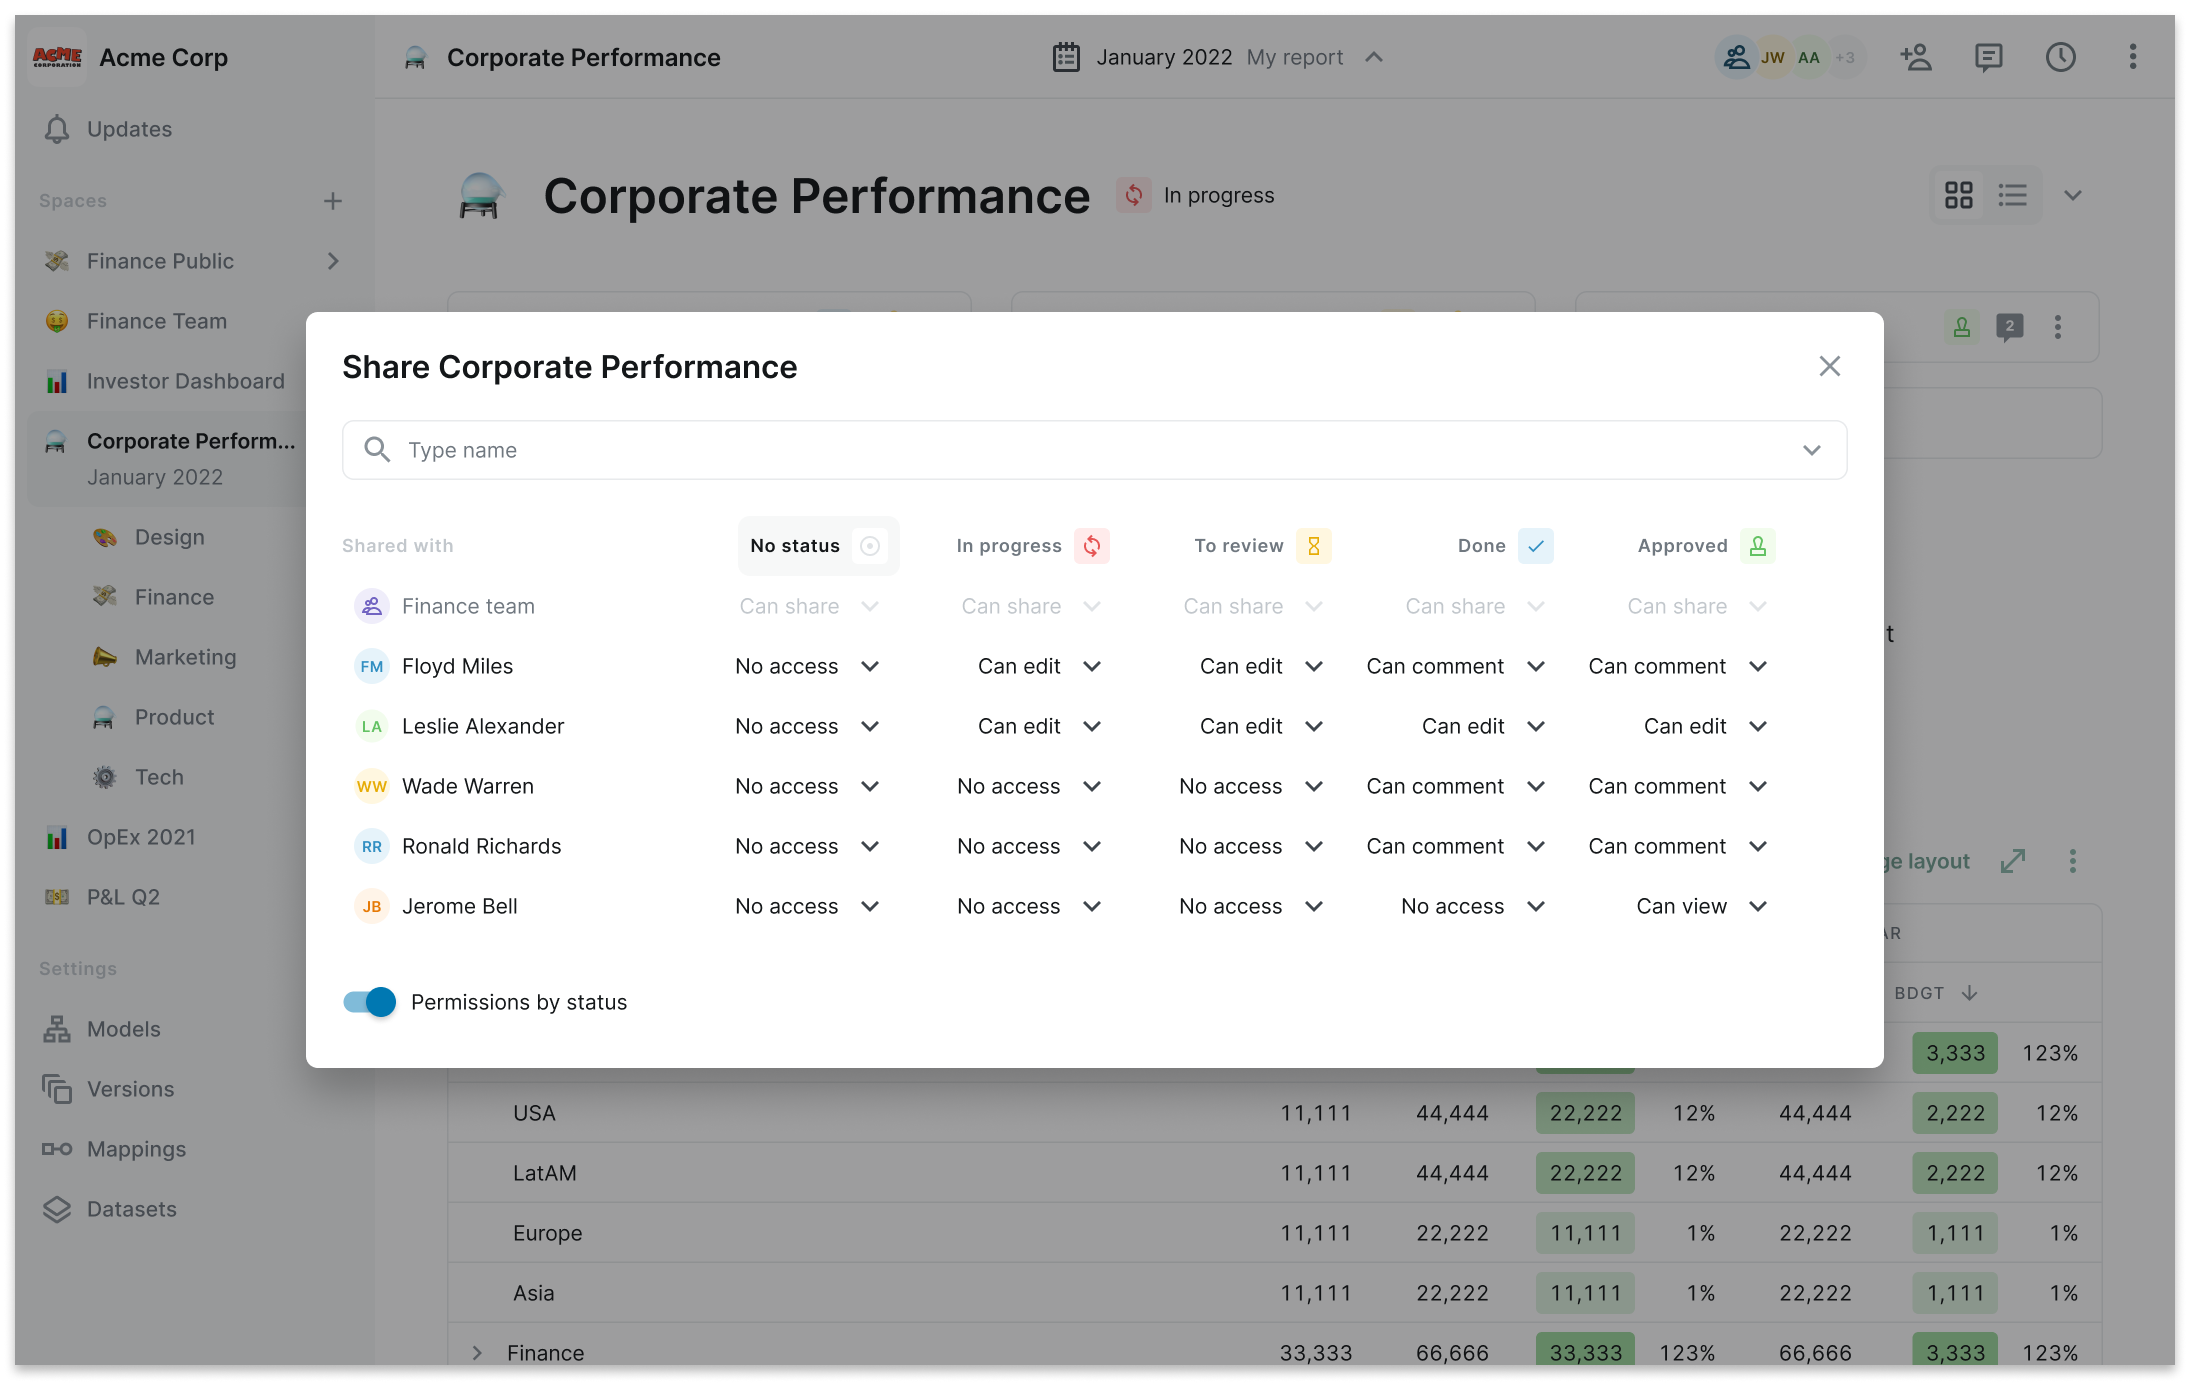
Permissions can be associated to specific status, providing more
granularity and covering more use cases.
Impact
The reporting experience is today one of the features that sets Abacum apart from its main competitors and also where the company found it’s product market fit.
In the first 30 days, the report functionality was adopted by 40% of our customers, and the overall activity in the platform also followed a positive increment.
Our customers (Mixpanel, Voicemod, IronHack) mentioned that with these solution, they were able to reduce the time spent on the monthly financial close by 50%.
-

“Collaborating with budget owners on our monthly corporate performance in Abacum has been game-changing. "
Nerea, Finance Controller @ Voicemod
-

“Very easy to build reports, and have my data ready. We’ve made faster and smarter decisions on a company-wide level.”
Xavier, CFO @ Typeform
-

"Abacum automated our manual tasks, accelerated the reporting process, and gave us more time to produce better analysis."
Maria, VP Finance @ IronHack
↓
Design Process
↓
Design Process ↓
7 min. read
7 min. read
Research
Together with research, we've started our design process by mapping out the user journey of our customers. We also conducted interviews with them and also with Finance experts.
This exercise allowed us to have a granular view over the customer's process, identify the most problematic moments and prioritise accordingly.
Findings
The main pain points identified were:
Send multiple spreadsheets;
A lot of back-and-forth discussions;
Lack of visibility on progress;
Lack of visibility on permissions;
A lot of manual tasks to consolidate information (charts, graphs, analysis, presentation, etc.)
User Journey
Our exercise mapping the user journey gained more granularity, allowing us to clearly identify pains & opportunities.
Framing the problem
Based on the insights gathered in the research phase, we created several HMWs to keep the team aligned and spark ideas.
How might we … ?
… allow users to create monthly versions of their reports?
… notify budget owners automatically?
… give visibility over the progress of a monthly report cycle?
… provide more granular permissions/access to the workspaces?
Ideation
The previous questions allowed us to kick-off the sketch phase, where we explored a few ideas that we believe could have a bigger impact.
Key ideas explored explored in these sketches:
Binding the reports to specific periods of time;
Provide feedback on the report progress;
Permissions and access based on the workspace's status.
Sacrificial Concepts
We would engage in discussions to consolidate the best ideas, and then synthesize them into different concepts, to be validated by engineering and also the customers.
This approach proved to be an efficient way of learning in which direction to move in since all the concepts presented were substantially different from each other.
The concepts would then be scored based on reach, impact, confidence and effort.
Exploring Multiple Solutions
The concepts would then be transformed into detailed mockups, where I explored multiple design solutions to address specific pain points.
We subjected the various design iterations to user testing interviews, which enabled us to refine the design and proceed with a solid solution.
This sessions were conducted via video call and we focused on observing the customers think aloud, while they interact with the different prototypes.
Implementation & Roll out
Through this process, we identified a range of features that not only made report creation effortless but also improved the overall product experience.
At this stage, the team opted to roll out the initiative in two different phases.
The initial iteration focused on allowing users to set up the report structure and get accustomed to its logic. Whilst the second phase would primarily address reducing the manual and repetitive work involved in report creation, making it simpler to do it on a recurring basis.
Metrics
Following the release of the entire set of features, the reports functionality was quickly adopted and the number of active users increased from 17 to 24 within the first 30 days, representing a 40% growth. These values remained consistent over time (1st graphic).
Furthermore, we observed increased activity within the entire platform after this release (2nd graphic).
Learnings
We understood that by enabling more collaboration features in Abacum, we helped users deepen their engagement with the platform.
This proved to be both challenging and exciting, as we were addressing a complex use case with multiple problems to solve, which required a strong collaboration within our squad.
